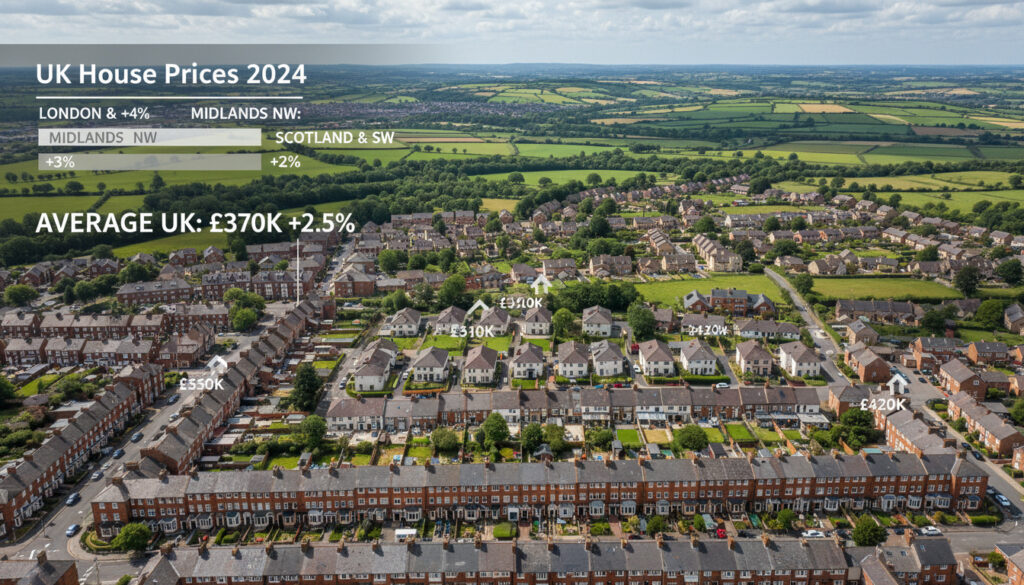
Average House Price UK – 2024 Data and Regional Trends
The UK housing market entered 2024 with mixed signals, as official data revealed significant variation in average property values across regions. While headline figures suggest modest national growth, the reality on the ground reflects a deepening north-south divide, with northern regions outpacing southern counterparts for the first time in years. Understanding these dynamics requires examining multiple data sources, each offering distinct perspectives on what buyers can actually expect to pay.
Recent reports from the Office for National Statistics, Nationwide Building Society, and the UK House Price Index present slightly different averages, ranging from approximately £268,000 to £306,000 depending on methodology and geography. These discrepancies highlight the complexity of tracking property values in a market where transaction volumes, mortgage approvals, and regional economic factors create constantly shifting conditions.
For prospective buyers, sellers, and investors, the current landscape presents both opportunities and challenges. Affordability remains stretched in southern England, while northern markets offer relatively accessible entry points. This analysis examines the latest available data to provide a clear picture of where the market stands today.
What is the average house price in the UK?
Determining a single definitive figure for the UK Average House Price in 2024 requires navigating multiple authoritative sources. The Office for National Statistics recorded a UK average of £290,000 in July 2024, representing a 2.2% annual increase. Meanwhile, Nationwide Building Society’s Q4 2024 data placed the average at £268,518, up 3.6% year-on-year. These variations stem from different methodologies—ONS data reflects completed transactions, while Nationwide figures derive from mortgage approvals.
Key observations from the latest data reveal several critical trends:
- Multiple authoritative sources confirm UK prices rose approximately £6,000 during 2024
- England maintains the highest average among UK constituent countries at roughly £306,000
- Data varies significantly between lenders and government statisticians due to methodological differences
- Q4 2024 showed particular strength according to Nationwide’s mortgage-based index
- Scotland and Wales remain more affordable than England overall, with averages around £195,000 and £219,000 respectively
- Northern Ireland recorded the strongest annual growth at 7.1% according to Nationwide’s regional analysis
- Transaction-based indices show different patterns than mortgage-approval based measures, particularly in cash-buyer heavy markets
| Metric | Value | Date | Source |
|---|---|---|---|
| UK Average | £290,000 | July 2024 | ONS |
| UK Average (Mortgage-based) | £268,518 | Q4 2024 | Nationwide |
| England Average | £306,494 | Q3 2024 | GOV.UK/UKHPI |
| Wales Average | £218,184 | July 2024 | ONS |
| Scotland Average | £195,036 | Q3 2024 | GOV.UK |
| Northern Ireland Average | £190,553 | Q3 2024 | GOV.UK |
| Annual Change (ONS) | +2.2% | July 2024 | ONS |
| Annual Change (Nationwide) | +3.6% | Q4 2024 | Nationwide |
What are average house prices by region in the UK?
The Regional Breakdown (2024) reveals a stark north-south divide that defined market performance throughout the year. While London retained its position as the most expensive region with averages exceeding £511,000, it simultaneously experienced the weakest performance in terms of annual growth, with some indices recording declines of up to 0.4%.
Which regions saw the strongest growth?
Northern regions dominated 2024’s growth tables. The North East led England with a 5.9% annual increase according to GOV.UK data, bringing averages to approximately £168,791. Nationwide’s broader “North” category, encompassing the North East, North West, and Yorkshire and Humber, recorded collective growth of 5.9%. Northern Ireland outperformed all UK regions with a 7.1% annual rise, despite maintaining the lowest average prices.
The North West demonstrated consistent strength across multiple indices, showing 5.5% annual growth per Nationwide and 5.7% per GOV.UK data. Yorkshire and Humber also posted robust figures around 4.4%, suggesting a broad-based northern recovery rather than isolated pockets of growth.
Where are prices declining or stagnating?
Southern England presented a contrasting picture. London’s average of £520,747 (ONS) or £511,279 (GOV.UK) represented a 0.1% to 0.4% annual decline depending on the source. East Anglia recorded the weakest growth nationwide at just 0.5%, while the South East managed only 0.5% annual growth despite maintaining high absolute values around £381,000.
London has experienced a sustained period of price correction throughout 2024, with early-year data showing declines of 4.8% year-on-year according to some sources. While Q3 and Q4 showed some stabilization, the capital remains the only major UK region consistently recording negative annual growth across multiple indices. This divergence marks a significant shift from the previous decade when London consistently outperformed northern regions.
How have UK house prices changed recently?
Understanding current movements requires examining both recent quarterly fluctuations and longer-term trajectories. The market displayed notable volatility throughout 2024, with some indices showing median price declines in England and Wales during the third quarter, while others recorded strong fourth-quarter surges.
The 2024 market trajectory
Data from the Office for National Statistics indicates that median prices in England and Wales fell by 2.6% (£7,500) in the year to September 2024, creating a complex picture alongside mean-based averages that showed growth. This divergence suggests that while expensive properties continued trading at premium levels, the middle market experienced compression.
Nationwide’s Q4 2024 report described a “strong end to the year,” with December figures confirming the 3.6% annual rise. This late-year momentum suggests improving buyer confidence and potential stabilization of mortgage rates following the Bank of England’s monetary policy adjustments.
Historical context: A decade of growth
Long-term data provides essential perspective on current valuations. Over the past decade (2010-2025), the UK average house price increased by approximately £100,000, representing substantial capital appreciation despite periodic fluctuations. This growth has not been evenly distributed geographically.
Historical analysis reveals that between 2004 and 2023, the North East experienced the slowest growth at just 41%, with averages hovering around £158,000. During the same period, London prices effectively tripled those in the North East, rising 222%. This twenty-year divergence explains current affordability gaps, though 2024 marked a potential inflection point as northern markets began closing the growth gap.
What factors affect house prices in the UK?
Multiple interconnected variables drive valuation changes across different housing markets. These factors operate at national, regional, and local levels, creating the disparities evident in current data.
Interest rates and mortgage availability
The Bank of England’s base rate decisions throughout 2024 directly impacted buyer purchasing power. As rates stabilized following earlier hikes, mortgage affordability constraints eased slightly, though remained tighter than the historically low periods of 2020-2021. This environment particularly affected first-time buyers in high-value markets like London and the South East.
Limited specific 2024 data exists for first-time buyer averages, though affordability metrics worsened across England and Wales. Northern regions currently offer the most accessible entry points, with terraced properties in the North East averaging below £85,000 in some areas as of 2023. Regional affordability data suggests that first-time buyers are increasingly targeting northern cities where deposit requirements remain achievable relative to local wages.
Supply constraints and construction rates
Persistent undersupply relative to housing formation continues supporting prices despite economic headwinds. Construction bottlenecks, planning restrictions, and material cost inflation have limited new housing delivery, particularly in constrained southern markets where green belt policies restrict expansion.
Regional economic disparities
Employment concentrations, infrastructure investment, and wage growth differentials explain much of the regional variation. Northern regions benefiting from levelling-up initiatives and improved transport links saw increased investor interest, while London’s financial sector adjustments contributed to price stagnation in prime central areas.
Forecasts suggest UK prices will remain stable or rise modestly through 2025, continuing the decade-long upward trajectory despite recent fluctuations. The strength of Q4 2024 provides a positive signal for near-term stability, though long-term projections remain subject to interest rate volatility and economic growth patterns. No detailed regional forecasts are currently available from major indices.
How have UK house prices evolved over time?
Tracking the market’s development reveals cyclical patterns and structural shifts that contextualize current conditions.
-
North East records slowest UK growth at 41% cumulative, reaching approximately £158,000 average -
UK average increases by roughly £100,000 over the decade, per Statista historical data -
North East identified as most affordable region at £160,406 average -
London averages £539,336 but shows early signs of decline -
ONS records UK average at £290,000 with 2.2% annual growth -
England and Wales median prices fall 2.6% (£7,500) year-on-year -
Nationwide reports strong finish to year with 3.6% annual growth
What do we know for certain about UK house prices?
Distinguishing established facts from market speculation helps stakeholders make informed decisions. Current data provides clarity on several fronts while leaving other questions unresolved.
- Northern regions consistently outperformed southern ones in 2024 growth metrics
- London remains the most expensive UK region despite recording negative annual growth
- Multiple indices confirm a general upward trajectory in national averages over the past decade
- The North East offers the most affordable entry point for buyers at approximately £164,000-£168,000
- Northern Ireland posted the highest annual growth rate at 7.1%
- Whether the north-south growth reversal will continue through 2025
- Exact impact of potential Bank of England rate changes on affordability
- How transaction volume changes might affect reported averages in volatile markets
- Whether London’s price correction has reached its floor
- Long-term effects of remote working patterns on regional demand
Why do house prices vary so much across the UK?
Geographic price disparities reflect deep structural economic differences. London and the South East maintain premium valuations due to concentration of high-paying employment sectors, international investment demand, and constrained supply within the green belt. Conversely, northern regions historically experienced slower wage growth and lower investment levels, though recent infrastructure improvements and cost-of-living advantages are shifting migration patterns.
Local authority planning policies create additional variation, with restrictive development controls in desirable southern areas limiting housing stock expansion. Meanwhile, industrial heritage and lower baseline costs in some northern towns enable more affordable pricing despite improving connectivity to major economic centers.
Where does UK house price data come from?
Several authoritative bodies publish regular house price statistics, each employing distinct methodologies that explain the variations seen in headlines.
“The UK House Price Index (UK HPI) captures changes in the value of residential properties in the UK using data from HM Land Registry, Registers of Scotland, and Land and Property Services Northern Ireland.”
— GOV.UK House Price Index Summary, November 2024
The Land Registry provides the most comprehensive transaction-based data, recording actual sale prices rather than mortgage approvals or asking prices. This makes it slower to reflect market changes but more accurate for completed sales.
“House prices ended 2024 on a strong note, with prices increasing by 0.1% month-on-month in December, following 0.4% rise in November. This resulted in an annual growth rate of 3.6%, the strongest pace since January 2023.”
— Nationwide House Price Index Report, Q4 2024
Lender indices like Nationwide and Halifax base calculations on their mortgage approval data, offering more timely but narrower snapshots. The Negotiator and property portals provide additional market context through asking price data and agent surveys.
What is the current state of UK house prices?
The UK housing market in late 2024 presents a bifurcated picture: national averages continue rising modestly, supported by strong northern performance, while southern markets adjust to affordability constraints. With averages ranging from £268,000 to £290,000 depending on measurement method, buyers face significantly different prospects based on location. The regional divergence observed throughout 2024 suggests a market rebalancing that may continue into 2025, offering improved accessibility in previously overheated markets while presenting challenges for sellers in stagnant regions.
Frequently Asked Questions
What is the average first-time buyer house price UK?
Specific 2024 first-time buyer averages remain limited in published data. However, the most affordable entry points exist in the North East, where terraced properties average around £85,000, and Wales, where flats average approximately £65,000-£76,500.
How is average house price calculated UK?
The UK House Price Index calculates averages using completed transaction data from Land Registry records, while lender indices like Nationwide use mortgage approval data. ONS employs a mix of sources including Valuation Office Agency figures, creating methodological differences between reported averages.
What is the UK house price index?
The UK HPI is a joint publication by HM Land Registry, ONS, and devolved administration statisticians. It tracks residential property price changes monthly, using actual sale prices rather than mortgage offers or asking prices.
UK house price forecast 2025?
Forecasts indicate UK prices will remain stable or rise modestly during 2025. The strong Q4 2024 performance supports optimistic short-term projections, though much depends on Bank of England interest rate decisions and broader economic growth.
Average house price UK vs inflation?
While specific inflation-adjusted comparisons for 2024 require additional calculation, house prices have generally outpaced inflation over the past decade with the £100,000 nominal increase. However, real-term affordability depends on wage growth and interest rate environments.
What is a good house price UK?
“Good” value depends entirely on location and buyer circumstances. Currently, the North East offers averages around £164,000 compared to London’s £511,000+, making northern regions attractive for budget-conscious buyers while southern markets suit those prioritizing employment access.
More related posts
 Thank You in Korean: Formal & Informal with Pronunciation
 Bangladesh vs Sri Lanka – Head-to-Head Records and Stats
 Hand Car Wash Near Me – Locations, Prices & Best Options
 Easiest Language to Learn – FSI’s Top 10 for English Speakers
 Andrew Scott: Relationship, Friendships, and Career
 Cast of Fiddler on the Roof (Film) – Full Roles and Casting Facts
 CSK vs MI Timeline: IPL History, Head-to-Head & Key Matches
 Rachel Shenton Movies and TV Shows – Complete Filmography and Streaming Guide
